|
Download Data (XLS File) |
|
|||||
|
|||||
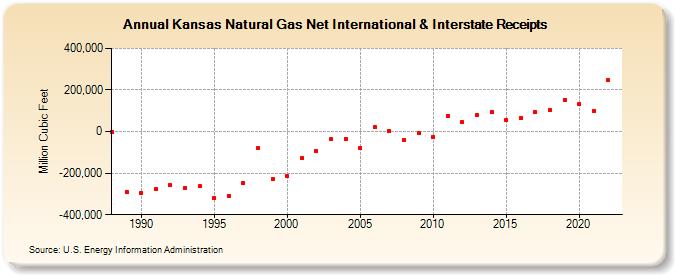
| Kansas Natural Gas Net International & Interstate Receipts (Million Cubic Feet) | |||||
| Decade | Year-0 | Year-1 | Year-2 | Year-3 | Year-4 | Year-5 | Year-6 | Year-7 | Year-8 | Year-9 |
|---|---|---|---|---|---|---|---|---|---|---|
| 1980's | 0 | -290,526 | ||||||||
| 1990's | -294,207 | -276,379 | -257,668 | -271,105 | -262,252 | -318,699 | -310,913 | -248,265 | -80,882 | -229,385 |
| 2000's | -214,192 | -127,500 | -94,309 | -37,436 | -33,888 | -79,505 | 20,283 | 2,327 | -39,894 | -7,158 |
| 2010's | -26,023 | 75,052 | 44,205 | 81,529 | 92,678 | 54,435 | 65,896 | 93,991 | 103,318 | 150,718 |
| 2020's | 130,800 | 100,925 | 246,483 | 163,383 | 165,889 |
| - = No Data Reported; -- = Not Applicable; NA = Not Available; W = Withheld to avoid disclosure of individual company data. |
| Release Date: 6/30/2026 |
| Next Release Date: 7/31/2026 |