|
Download Data (XLS File) |
|
|||||
|
|||||
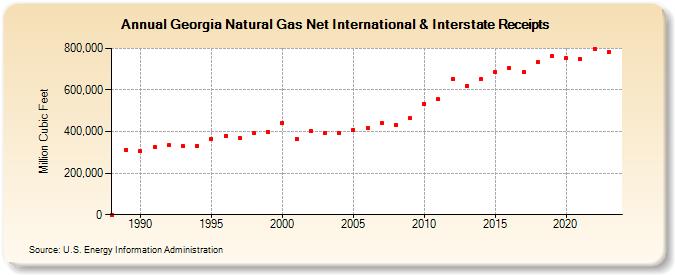
| Georgia Natural Gas Net International & Interstate Receipts (Million Cubic Feet) | |||||
| Decade | Year-0 | Year-1 | Year-2 | Year-3 | Year-4 | Year-5 | Year-6 | Year-7 | Year-8 | Year-9 |
|---|---|---|---|---|---|---|---|---|---|---|
| 1980's | 0 | 313,535 | ||||||||
| 1990's | 304,127 | 326,237 | 332,967 | 329,591 | 331,812 | 364,073 | 378,006 | 369,230 | 394,824 | 397,865 |
| 2000's | 442,386 | 364,871 | 404,711 | 394,839 | 394,732 | 408,325 | 416,092 | 442,260 | 432,305 | 463,176 |
| 2010's | 534,881 | 554,187 | 652,956 | 619,457 | 651,138 | 688,286 | 707,404 | 687,529 | 734,144 | 763,368 |
| 2020's | 753,165 | 749,030 | 798,802 | 783,835 | 779,610 |
| - = No Data Reported; -- = Not Applicable; NA = Not Available; W = Withheld to avoid disclosure of individual company data. |
| Release Date: 6/30/2026 |
| Next Release Date: 7/31/2026 |