|
Download Data (XLS File) |
|
|||||
|
|||||
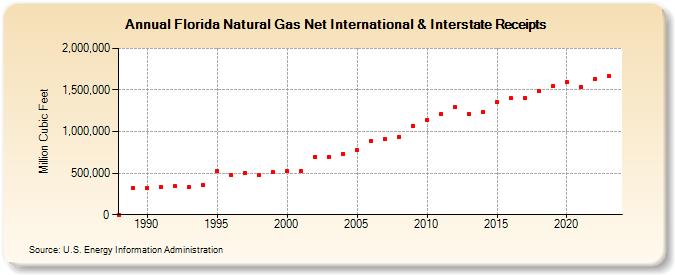
| Florida Natural Gas Net International & Interstate Receipts (Million Cubic Feet) | |||||
| Decade | Year-0 | Year-1 | Year-2 | Year-3 | Year-4 | Year-5 | Year-6 | Year-7 | Year-8 | Year-9 |
|---|---|---|---|---|---|---|---|---|---|---|
| 1980's | 0 | 322,766 | ||||||||
| 1990's | 325,863 | 335,734 | 341,325 | 336,155 | 359,143 | 523,687 | 483,052 | 503,126 | 472,632 | 508,613 |
| 2000's | 523,997 | 528,462 | 699,152 | 695,750 | 734,265 | 774,283 | 889,710 | 915,006 | 939,799 | 1,063,977 |
| 2010's | 1,143,135 | 1,208,317 | 1,294,620 | 1,208,598 | 1,233,331 | 1,354,710 | 1,397,470 | 1,402,225 | 1,486,154 | 1,547,676 |
| 2020's | 1,594,895 | 1,539,024 | 1,632,475 | 1,666,897 | 1,730,426 |
| - = No Data Reported; -- = Not Applicable; NA = Not Available; W = Withheld to avoid disclosure of individual company data. |
| Release Date: 6/30/2026 |
| Next Release Date: 7/31/2026 |