|
Download Data (XLS File) |
|
|||||
|
|||||
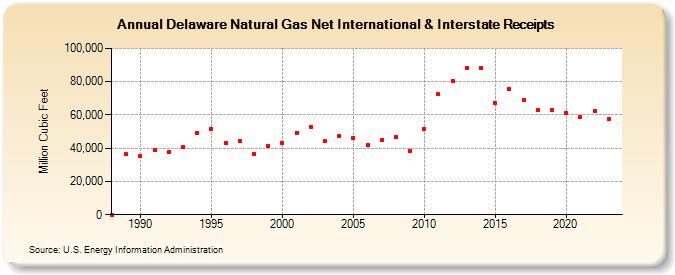
| Delaware Natural Gas Net International & Interstate Receipts (Million Cubic Feet) | |||||
| Decade | Year-0 | Year-1 | Year-2 | Year-3 | Year-4 | Year-5 | Year-6 | Year-7 | Year-8 | Year-9 |
|---|---|---|---|---|---|---|---|---|---|---|
| 1980's | 0 | 36,242 | ||||||||
| 1990's | 35,012 | 38,866 | 37,634 | 40,826 | 49,408 | 51,834 | 42,980 | 44,214 | 36,749 | 41,343 |
| 2000's | 43,107 | 49,327 | 52,603 | 44,338 | 47,117 | 46,376 | 42,030 | 44,660 | 46,485 | 38,497 |
| 2010's | 51,573 | 72,322 | 80,692 | 88,167 | 87,914 | 67,186 | 75,447 | 68,838 | 62,999 | 62,918 |
| 2020's | 61,307 | 58,752 | 62,627 | 57,562 | 55,713 |
| - = No Data Reported; -- = Not Applicable; NA = Not Available; W = Withheld to avoid disclosure of individual company data. |
| Release Date: 6/30/2026 |
| Next Release Date: 7/31/2026 |