|
Download Data (XLS File) |
|
|||||
|
|||||
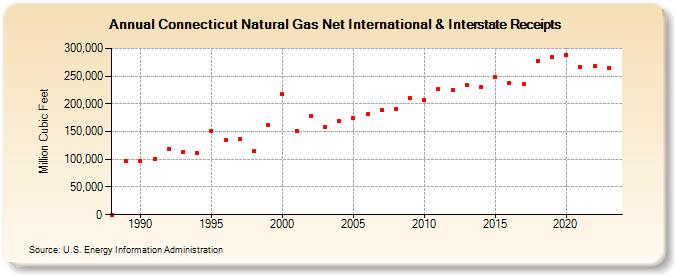
| Connecticut Natural Gas Net International & Interstate Receipts (Million Cubic Feet) | |||||
| Decade | Year-0 | Year-1 | Year-2 | Year-3 | Year-4 | Year-5 | Year-6 | Year-7 | Year-8 | Year-9 |
|---|---|---|---|---|---|---|---|---|---|---|
| 1980's | 0 | 97,369 | ||||||||
| 1990's | 96,469 | 100,939 | 118,601 | 113,682 | 110,478 | 151,154 | 134,294 | 136,910 | 114,837 | 161,005 |
| 2000's | 217,766 | 151,751 | 177,902 | 158,780 | 169,189 | 175,154 | 181,018 | 189,254 | 191,019 | 211,177 |
| 2010's | 206,249 | 226,188 | 225,170 | 234,034 | 230,186 | 247,745 | 237,025 | 235,864 | 277,241 | 285,213 |
| 2020's | 288,367 | 267,258 | 267,667 | 264,494 | 275,172 |
| - = No Data Reported; -- = Not Applicable; NA = Not Available; W = Withheld to avoid disclosure of individual company data. |
| Release Date: 6/30/2026 |
| Next Release Date: 7/31/2026 |