|
Download Data (XLS File) |
|
|||||
|
|||||
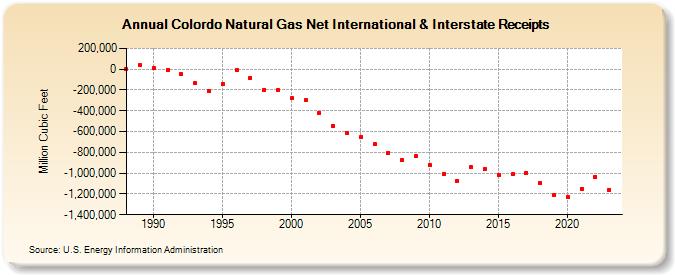
| Colordo Natural Gas Net International & Interstate Receipts (Million Cubic Feet) | |||||
| Decade | Year-0 | Year-1 | Year-2 | Year-3 | Year-4 | Year-5 | Year-6 | Year-7 | Year-8 | Year-9 |
|---|---|---|---|---|---|---|---|---|---|---|
| 1980's | 0 | 40,768 | ||||||||
| 1990's | 6,997 | -4,091 | -50,647 | -133,507 | -213,230 | -144,957 | -6,713 | -83,263 | -196,610 | -199,481 |
| 2000's | -280,974 | -300,712 | -421,063 | -541,798 | -610,382 | -653,572 | -723,139 | -803,692 | -872,318 | -837,670 |
| 2010's | -923,851 | -1,005,837 | -1,077,968 | -943,755 | -961,214 | -1,016,433 | -1,012,251 | -996,218 | -1,093,410 | -1,208,080 |
| 2020's | -1,227,479 | -1,149,504 | -1,036,861 | -1,157,898 | -1,191,689 |
| - = No Data Reported; -- = Not Applicable; NA = Not Available; W = Withheld to avoid disclosure of individual company data. |
| Release Date: 6/30/2026 |
| Next Release Date: 7/31/2026 |