|
Download Data (XLS File) |
|
|||||
|
|||||
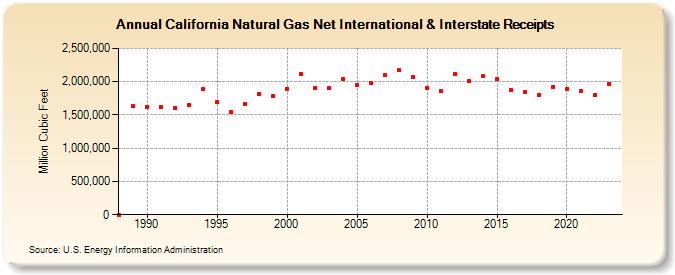
| California Natural Gas Net International & Interstate Receipts (Million Cubic Feet) | |||||
| Decade | Year-0 | Year-1 | Year-2 | Year-3 | Year-4 | Year-5 | Year-6 | Year-7 | Year-8 | Year-9 |
|---|---|---|---|---|---|---|---|---|---|---|
| 1980's | 0 | 1,627,420 | ||||||||
| 1990's | 1,620,132 | 1,623,693 | 1,610,708 | 1,654,143 | 1,887,149 | 1,690,530 | 1,547,503 | 1,670,820 | 1,818,366 | 1,791,454 |
| 2000's | 1,890,500 | 2,120,011 | 1,900,845 | 1,899,025 | 2,041,716 | 1,955,700 | 1,987,018 | 2,102,577 | 2,176,950 | 2,068,802 |
| 2010's | 1,908,917 | 1,865,068 | 2,112,568 | 2,004,422 | 2,080,014 | 2,032,474 | 1,872,283 | 1,843,210 | 1,805,982 | 1,922,731 |
| 2020's | 1,895,679 | 1,864,023 | 1,797,625 | 1,966,209 | 1,757,943 |
| - = No Data Reported; -- = Not Applicable; NA = Not Available; W = Withheld to avoid disclosure of individual company data. |
| Release Date: 6/30/2026 |
| Next Release Date: 7/31/2026 |