|
Download Data (XLS File) |
|
|||||
|
|||||
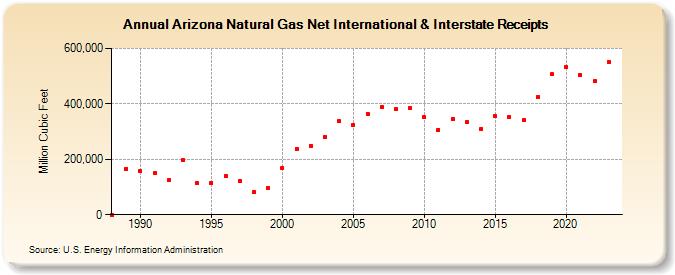
| Arizona Natural Gas Net International & Interstate Receipts (Million Cubic Feet) | |||||
| Decade | Year-0 | Year-1 | Year-2 | Year-3 | Year-4 | Year-5 | Year-6 | Year-7 | Year-8 | Year-9 |
|---|---|---|---|---|---|---|---|---|---|---|
| 1980's | 0 | 165,914 | ||||||||
| 1990's | 156,263 | 149,159 | 124,161 | 198,102 | 112,688 | 114,902 | 139,881 | 121,317 | 82,678 | 95,225 |
| 2000's | 168,978 | 237,111 | 248,929 | 281,044 | 336,350 | 323,588 | 364,278 | 389,135 | 381,187 | 384,852 |
| 2010's | 351,481 | 306,795 | 345,198 | 333,353 | 309,535 | 354,587 | 353,116 | 340,899 | 425,555 | 506,380 |
| 2020's | 533,476 | 504,300 | 481,020 | 551,626 | 557,365 |
| - = No Data Reported; -- = Not Applicable; NA = Not Available; W = Withheld to avoid disclosure of individual company data. |
| Release Date: 6/30/2026 |
| Next Release Date: 7/31/2026 |