|
Download Data (XLS File) |
|
|||||
|
|||||
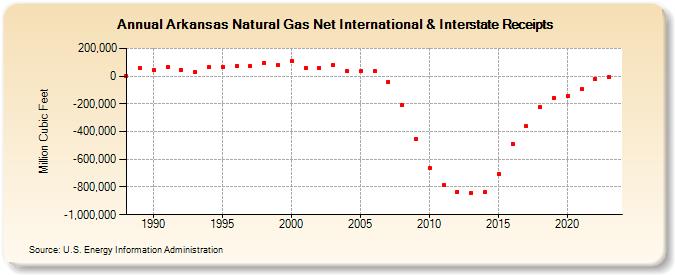
| Arkansas Natural Gas Net International & Interstate Receipts (Million Cubic Feet) | |||||
| Decade | Year-0 | Year-1 | Year-2 | Year-3 | Year-4 | Year-5 | Year-6 | Year-7 | Year-8 | Year-9 |
|---|---|---|---|---|---|---|---|---|---|---|
| 1980's | 0 | 58,643 | ||||||||
| 1990's | 43,553 | 64,424 | 42,289 | 31,184 | 63,880 | 68,073 | 73,669 | 72,846 | 96,715 | 79,993 |
| 2000's | 109,180 | 60,149 | 61,669 | 79,114 | 34,406 | 33,505 | 35,161 | -39,695 | -210,039 | -455,116 |
| 2010's | -664,031 | -786,971 | -833,014 | -841,017 | -836,627 | -702,773 | -486,732 | -363,534 | -223,487 | -157,096 |
| 2020's | -147,012 | -92,497 | -22,397 | -5,677 | 16,329 |
| - = No Data Reported; -- = Not Applicable; NA = Not Available; W = Withheld to avoid disclosure of individual company data. |
| Release Date: 6/30/2026 |
| Next Release Date: 7/31/2026 |