|
Download Data (XLS File) |
|
|||||
|
|||||
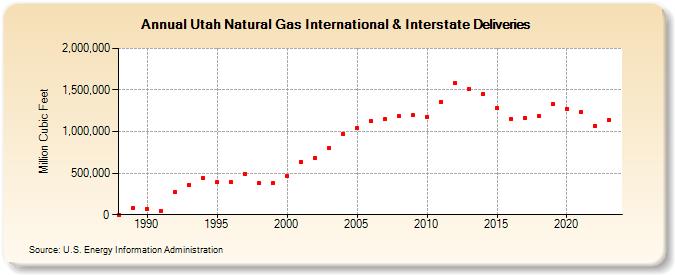
| Utah Natural Gas International & Interstate Deliveries (Million Cubic Feet) | |||||
| Decade | Year-0 | Year-1 | Year-2 | Year-3 | Year-4 | Year-5 | Year-6 | Year-7 | Year-8 | Year-9 |
|---|---|---|---|---|---|---|---|---|---|---|
| 1980's | 0 | 84,990 | ||||||||
| 1990's | 72,020 | 48,664 | 273,310 | 361,042 | 440,415 | 388,831 | 390,959 | 494,909 | 376,224 | 381,416 |
| 2000's | 464,167 | 638,122 | 685,217 | 801,822 | 975,104 | 1,044,381 | 1,127,527 | 1,146,860 | 1,181,903 | 1,196,229 |
| 2010's | 1,178,131 | 1,359,751 | 1,584,593 | 1,512,689 | 1,450,117 | 1,282,164 | 1,155,885 | 1,160,113 | 1,187,190 | 1,332,446 |
| 2020's | 1,275,713 | 1,232,897 | 1,070,028 | 1,142,596 | 1,020,853 |
| - = No Data Reported; -- = Not Applicable; NA = Not Available; W = Withheld to avoid disclosure of individual company data. |
| Release Date: 6/30/2026 |
| Next Release Date: 7/31/2026 |
Referring Pages: