|
Download Data (XLS File) |
|
|||||
|
|||||
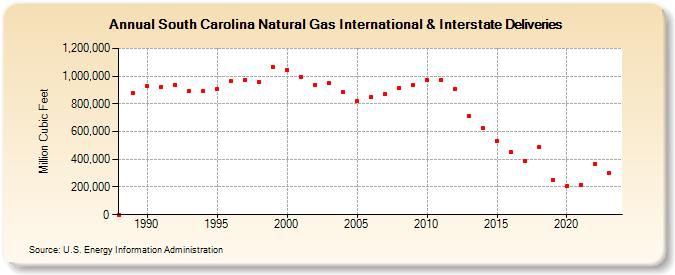
| South Carolina Natural Gas International & Interstate Deliveries (Million Cubic Feet) | |||||
| Decade | Year-0 | Year-1 | Year-2 | Year-3 | Year-4 | Year-5 | Year-6 | Year-7 | Year-8 | Year-9 |
|---|---|---|---|---|---|---|---|---|---|---|
| 1980's | 0 | 876,596 | ||||||||
| 1990's | 926,742 | 923,920 | 937,086 | 893,469 | 896,007 | 906,316 | 965,420 | 971,634 | 957,525 | 1,069,291 |
| 2000's | 1,046,316 | 993,673 | 937,957 | 946,937 | 882,417 | 818,159 | 846,017 | 869,883 | 917,065 | 936,090 |
| 2010's | 969,251 | 971,418 | 908,475 | 708,832 | 623,696 | 528,691 | 450,231 | 386,662 | 490,198 | 251,667 |
| 2020's | 203,964 | 216,465 | 366,750 | 300,198 | 327,149 |
| - = No Data Reported; -- = Not Applicable; NA = Not Available; W = Withheld to avoid disclosure of individual company data. |
| Release Date: 6/30/2026 |
| Next Release Date: 7/31/2026 |