|
Download Data (XLS File) |
|
|||||
|
|||||
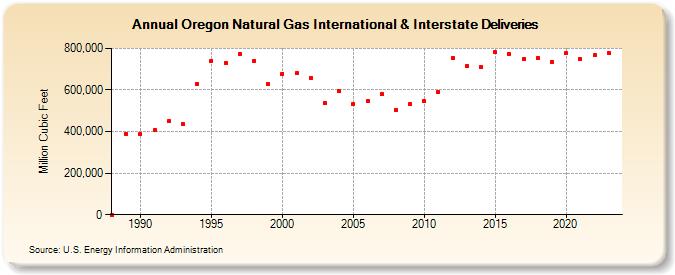
| Oregon Natural Gas International & Interstate Deliveries (Million Cubic Feet) | |||||
| Decade | Year-0 | Year-1 | Year-2 | Year-3 | Year-4 | Year-5 | Year-6 | Year-7 | Year-8 | Year-9 |
|---|---|---|---|---|---|---|---|---|---|---|
| 1980's | 0 | 390,029 | ||||||||
| 1990's | 387,778 | 405,163 | 450,261 | 435,002 | 628,931 | 741,523 | 728,952 | 773,152 | 740,433 | 628,608 |
| 2000's | 678,458 | 680,368 | 659,944 | 536,776 | 592,855 | 531,868 | 545,670 | 580,638 | 504,550 | 533,197 |
| 2010's | 546,254 | 590,489 | 756,096 | 713,049 | 710,137 | 780,662 | 774,120 | 749,868 | 755,167 | 735,872 |
| 2020's | 776,347 | 749,394 | 766,631 | 777,993 | 756,365 |
| - = No Data Reported; -- = Not Applicable; NA = Not Available; W = Withheld to avoid disclosure of individual company data. |
| Release Date: 6/30/2026 |
| Next Release Date: 7/31/2026 |