|
Download Data (XLS File) |
|
|||||
|
|||||
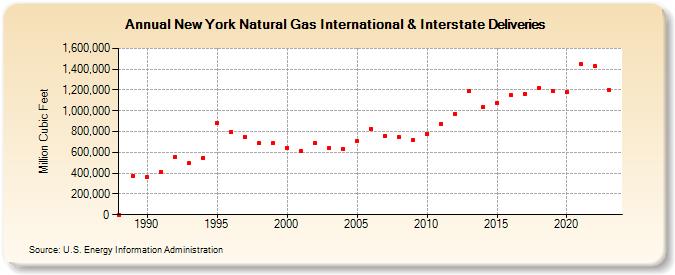
| New York Natural Gas International & Interstate Deliveries (Million Cubic Feet) | |||||
| Decade | Year-0 | Year-1 | Year-2 | Year-3 | Year-4 | Year-5 | Year-6 | Year-7 | Year-8 | Year-9 |
|---|---|---|---|---|---|---|---|---|---|---|
| 1980's | 0 | 375,695 | ||||||||
| 1990's | 360,693 | 414,155 | 559,844 | 495,010 | 549,862 | 886,014 | 798,572 | 746,689 | 686,882 | 690,146 |
| 2000's | 646,212 | 608,729 | 689,482 | 638,724 | 630,581 | 710,856 | 829,103 | 759,016 | 747,528 | 718,739 |
| 2010's | 779,299 | 873,933 | 971,060 | 1,191,020 | 1,032,794 | 1,077,837 | 1,150,256 | 1,165,150 | 1,222,400 | 1,193,481 |
| 2020's | 1,182,167 | 1,449,339 | 1,427,603 | 1,204,028 | 1,226,716 |
| - = No Data Reported; -- = Not Applicable; NA = Not Available; W = Withheld to avoid disclosure of individual company data. |
| Release Date: 6/30/2026 |
| Next Release Date: 7/31/2026 |