|
Download Data (XLS File) |
|
|||||
|
|||||
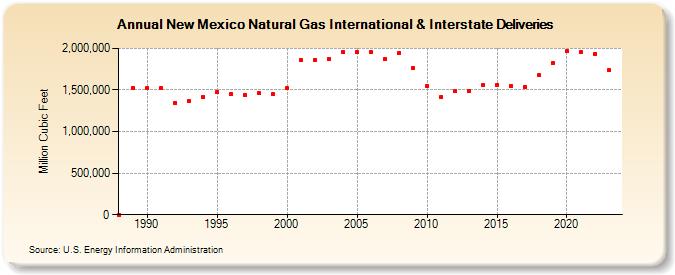
| New Mexico Natural Gas International & Interstate Deliveries (Million Cubic Feet) | |||||
| Decade | Year-0 | Year-1 | Year-2 | Year-3 | Year-4 | Year-5 | Year-6 | Year-7 | Year-8 | Year-9 |
|---|---|---|---|---|---|---|---|---|---|---|
| 1980's | 0 | 1,523,896 | ||||||||
| 1990's | 1,519,563 | 1,517,997 | 1,348,520 | 1,362,958 | 1,417,608 | 1,470,532 | 1,452,364 | 1,441,218 | 1,459,182 | 1,449,390 |
| 2000's | 1,517,702 | 1,856,119 | 1,863,822 | 1,878,344 | 1,953,318 | 1,955,311 | 1,954,159 | 1,868,850 | 1,947,133 | 1,762,392 |
| 2010's | 1,542,104 | 1,410,622 | 1,482,540 | 1,493,363 | 1,555,517 | 1,561,911 | 1,548,315 | 1,539,168 | 1,674,384 | 1,826,372 |
| 2020's | 1,967,960 | 1,960,626 | 1,932,670 | 1,735,322 | 1,675,236 |
| - = No Data Reported; -- = Not Applicable; NA = Not Available; W = Withheld to avoid disclosure of individual company data. |
| Release Date: 6/30/2026 |
| Next Release Date: 7/31/2026 |