|
Download Data (XLS File) |
|
|||||
|
|||||
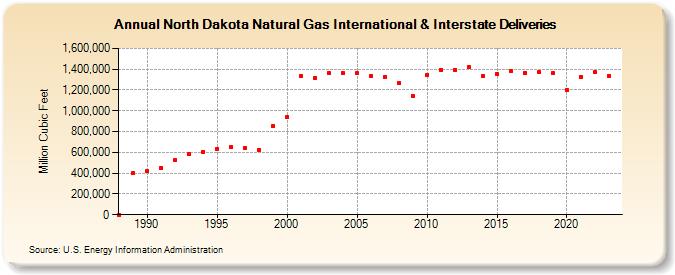
| North Dakota Natural Gas International & Interstate Deliveries (Million Cubic Feet) | |||||
| Decade | Year-0 | Year-1 | Year-2 | Year-3 | Year-4 | Year-5 | Year-6 | Year-7 | Year-8 | Year-9 |
|---|---|---|---|---|---|---|---|---|---|---|
| 1980's | 0 | 402,546 | ||||||||
| 1990's | 416,428 | 454,014 | 528,330 | 581,442 | 607,129 | 636,351 | 653,690 | 642,906 | 627,044 | 851,305 |
| 2000's | 940,713 | 1,334,215 | 1,314,016 | 1,363,704 | 1,360,856 | 1,359,360 | 1,333,573 | 1,328,138 | 1,267,877 | 1,144,893 |
| 2010's | 1,348,477 | 1,395,299 | 1,395,033 | 1,422,333 | 1,332,118 | 1,356,682 | 1,385,620 | 1,367,107 | 1,372,440 | 1,363,115 |
| 2020's | 1,201,503 | 1,327,633 | 1,369,751 | 1,334,525 | 1,402,664 |
| - = No Data Reported; -- = Not Applicable; NA = Not Available; W = Withheld to avoid disclosure of individual company data. |
| Release Date: 6/30/2026 |
| Next Release Date: 7/31/2026 |