|
Download Data (XLS File) |
|
|||||
|
|||||
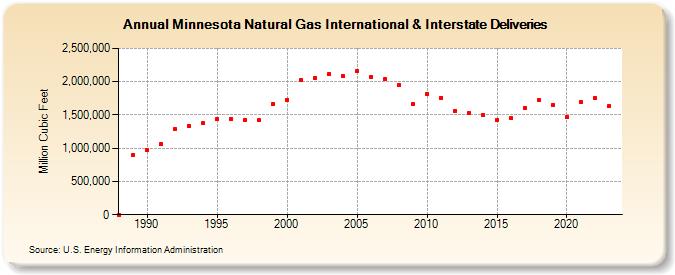
| Minnesota Natural Gas International & Interstate Deliveries (Million Cubic Feet) | |||||
| Decade | Year-0 | Year-1 | Year-2 | Year-3 | Year-4 | Year-5 | Year-6 | Year-7 | Year-8 | Year-9 |
|---|---|---|---|---|---|---|---|---|---|---|
| 1980's | 0 | 902,177 | ||||||||
| 1990's | 966,202 | 1,065,366 | 1,288,392 | 1,335,315 | 1,377,432 | 1,434,132 | 1,443,843 | 1,429,306 | 1,417,230 | 1,665,731 |
| 2000's | 1,730,499 | 2,026,551 | 2,058,147 | 2,112,501 | 2,078,730 | 2,161,569 | 2,073,178 | 2,032,481 | 1,946,899 | 1,659,019 |
| 2010's | 1,817,267 | 1,759,741 | 1,565,157 | 1,529,066 | 1,500,165 | 1,422,016 | 1,457,090 | 1,609,207 | 1,725,998 | 1,652,990 |
| 2020's | 1,462,411 | 1,687,776 | 1,751,204 | 1,632,853 | 1,786,485 |
| - = No Data Reported; -- = Not Applicable; NA = Not Available; W = Withheld to avoid disclosure of individual company data. |
| Release Date: 6/30/2026 |
| Next Release Date: 7/31/2026 |