|
Download Data (XLS File) |
|
|||||
|
|||||
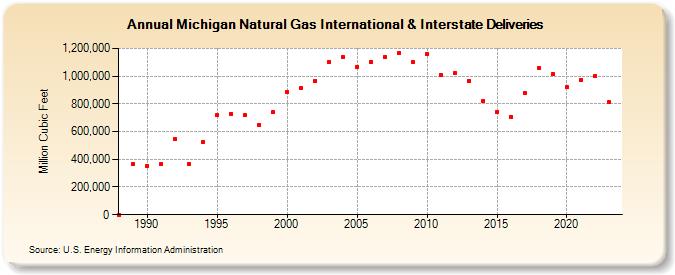
| Michigan Natural Gas International & Interstate Deliveries (Million Cubic Feet) | |||||
| Decade | Year-0 | Year-1 | Year-2 | Year-3 | Year-4 | Year-5 | Year-6 | Year-7 | Year-8 | Year-9 |
|---|---|---|---|---|---|---|---|---|---|---|
| 1980's | 0 | 365,176 | ||||||||
| 1990's | 352,234 | 363,547 | 545,637 | 368,936 | 521,969 | 716,019 | 726,625 | 719,394 | 649,885 | 738,656 |
| 2000's | 884,468 | 917,267 | 966,524 | 1,102,126 | 1,139,584 | 1,068,121 | 1,100,933 | 1,140,793 | 1,168,691 | 1,099,198 |
| 2010's | 1,161,346 | 1,007,401 | 1,023,488 | 965,031 | 819,238 | 744,605 | 708,086 | 874,756 | 1,061,791 | 1,016,531 |
| 2020's | 918,546 | 970,831 | 1,000,807 | 811,301 | 746,629 |
| - = No Data Reported; -- = Not Applicable; NA = Not Available; W = Withheld to avoid disclosure of individual company data. |
| Release Date: 6/30/2026 |
| Next Release Date: 7/31/2026 |