|
Download Data (XLS File) |
|
|||||
|
|||||
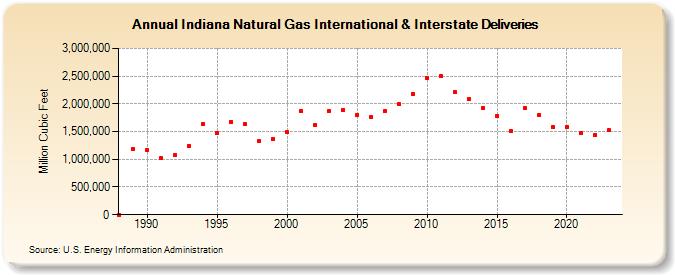
| Indiana Natural Gas International & Interstate Deliveries (Million Cubic Feet) | |||||
| Decade | Year-0 | Year-1 | Year-2 | Year-3 | Year-4 | Year-5 | Year-6 | Year-7 | Year-8 | Year-9 |
|---|---|---|---|---|---|---|---|---|---|---|
| 1980's | 0 | 1,182,560 | ||||||||
| 1990's | 1,159,628 | 1,018,361 | 1,082,783 | 1,239,776 | 1,632,229 | 1,475,557 | 1,680,509 | 1,628,553 | 1,328,356 | 1,370,379 |
| 2000's | 1,491,840 | 1,870,394 | 1,616,275 | 1,874,734 | 1,889,351 | 1,804,783 | 1,757,950 | 1,873,603 | 1,988,280 | 2,175,417 |
| 2010's | 2,464,272 | 2,500,852 | 2,206,126 | 2,091,424 | 1,928,794 | 1,782,688 | 1,507,429 | 1,916,052 | 1,799,680 | 1,584,382 |
| 2020's | 1,589,888 | 1,475,543 | 1,438,193 | 1,519,378 | 1,359,229 |
| - = No Data Reported; -- = Not Applicable; NA = Not Available; W = Withheld to avoid disclosure of individual company data. |
| Release Date: 6/30/2026 |
| Next Release Date: 7/31/2026 |