|
Download Data (XLS File) |
|
|||||
|
|||||
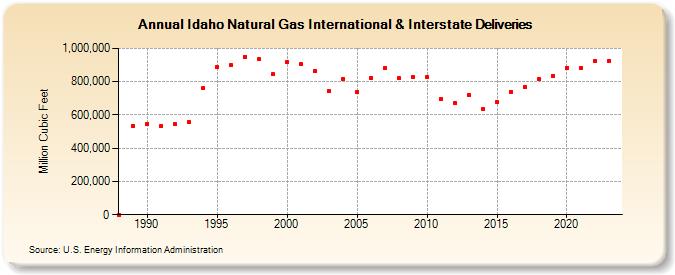
| Idaho Natural Gas International & Interstate Deliveries (Million Cubic Feet) | |||||
| Decade | Year-0 | Year-1 | Year-2 | Year-3 | Year-4 | Year-5 | Year-6 | Year-7 | Year-8 | Year-9 |
|---|---|---|---|---|---|---|---|---|---|---|
| 1980's | 0 | 534,497 | ||||||||
| 1990's | 546,339 | 532,277 | 543,842 | 554,834 | 759,717 | 887,158 | 899,611 | 950,876 | 935,098 | 844,465 |
| 2000's | 917,141 | 903,421 | 862,861 | 743,271 | 816,311 | 739,356 | 823,211 | 881,766 | 819,201 | 827,263 |
| 2010's | 826,780 | 697,988 | 670,996 | 719,942 | 632,754 | 680,228 | 737,986 | 767,098 | 813,706 | 834,660 |
| 2020's | 883,940 | 882,328 | 926,225 | 924,747 | 934,508 |
| - = No Data Reported; -- = Not Applicable; NA = Not Available; W = Withheld to avoid disclosure of individual company data. |
| Release Date: 6/30/2026 |
| Next Release Date: 7/31/2026 |
Referring Pages: