|
Download Data (XLS File) |
|
|||||
|
|||||
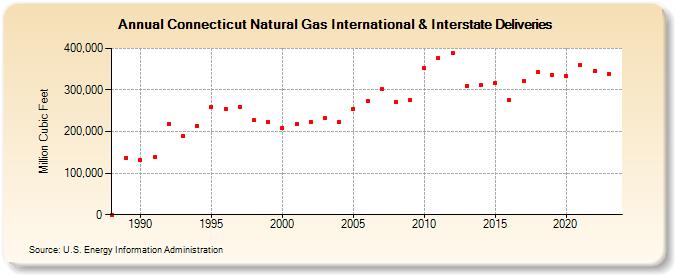
| Connecticut Natural Gas International & Interstate Deliveries (Million Cubic Feet) | |||||
| Decade | Year-0 | Year-1 | Year-2 | Year-3 | Year-4 | Year-5 | Year-6 | Year-7 | Year-8 | Year-9 |
|---|---|---|---|---|---|---|---|---|---|---|
| 1980's | 0 | 137,224 | ||||||||
| 1990's | 131,255 | 138,751 | 218,371 | 188,443 | 214,098 | 259,486 | 254,633 | 259,700 | 227,644 | 222,593 |
| 2000's | 209,454 | 217,394 | 223,550 | 231,981 | 222,899 | 254,740 | 273,034 | 302,201 | 270,796 | 275,876 |
| 2010's | 351,833 | 376,688 | 387,750 | 309,667 | 311,169 | 316,434 | 275,484 | 322,717 | 343,260 | 336,961 |
| 2020's | 333,087 | 360,797 | 345,045 | 338,406 | 363,061 |
| - = No Data Reported; -- = Not Applicable; NA = Not Available; W = Withheld to avoid disclosure of individual company data. |
| Release Date: 6/30/2026 |
| Next Release Date: 7/31/2026 |