|
Download Data (XLS File) |
|
|||||
|
|||||
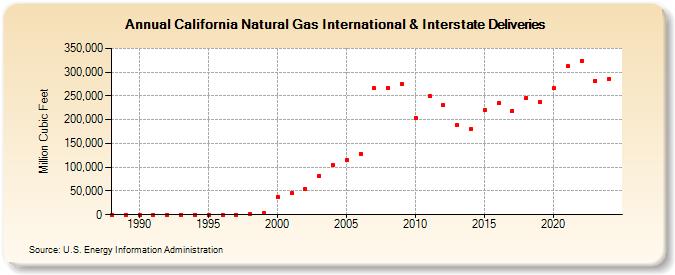
| California Natural Gas International & Interstate Deliveries (Million Cubic Feet) | |||||
| Decade | Year-0 | Year-1 | Year-2 | Year-3 | Year-4 | Year-5 | Year-6 | Year-7 | Year-8 | Year-9 |
|---|---|---|---|---|---|---|---|---|---|---|
| 1980's | 0 | 0 | ||||||||
| 1990's | 0 | 0 | 0 | 0 | 0 | 0 | 0 | 308 | 2,067 | 3,761 |
| 2000's | 37,961 | 45,828 | 54,494 | 82,390 | 104,222 | 114,773 | 128,508 | 265,826 | 267,560 | 275,843 |
| 2010's | 203,781 | 249,093 | 230,551 | 187,794 | 180,451 | 219,476 | 235,938 | 218,398 | 246,652 | 237,458 |
| 2020's | 265,788 | 312,564 | 324,168 | 282,099 | 285,300 |
| - = No Data Reported; -- = Not Applicable; NA = Not Available; W = Withheld to avoid disclosure of individual company data. |
| Release Date: 6/30/2026 |
| Next Release Date: 7/31/2026 |