|
Download Data (XLS File) |
|
|||||
|
|||||
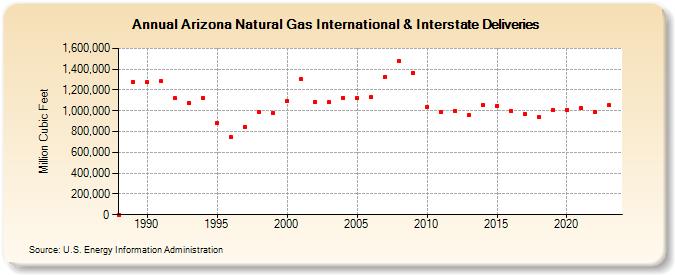
| Arizona Natural Gas International & Interstate Deliveries (Million Cubic Feet) | |||||
| Decade | Year-0 | Year-1 | Year-2 | Year-3 | Year-4 | Year-5 | Year-6 | Year-7 | Year-8 | Year-9 |
|---|---|---|---|---|---|---|---|---|---|---|
| 1980's | 0 | 1,277,161 | ||||||||
| 1990's | 1,272,137 | 1,281,549 | 1,120,062 | 1,072,547 | 1,122,007 | 879,201 | 744,037 | 848,353 | 986,683 | 981,320 |
| 2000's | 1,093,294 | 1,302,664 | 1,086,325 | 1,079,700 | 1,123,832 | 1,120,728 | 1,132,005 | 1,326,627 | 1,476,968 | 1,368,031 |
| 2010's | 1,036,166 | 985,759 | 998,257 | 961,091 | 1,051,612 | 1,050,585 | 997,025 | 967,849 | 939,958 | 1,009,937 |
| 2020's | 1,010,919 | 1,024,859 | 991,387 | 1,052,817 | 980,903 |
| - = No Data Reported; -- = Not Applicable; NA = Not Available; W = Withheld to avoid disclosure of individual company data. |
| Release Date: 6/30/2026 |
| Next Release Date: 7/31/2026 |