|
Download Data (XLS File) |
|
|||||
|
|||||
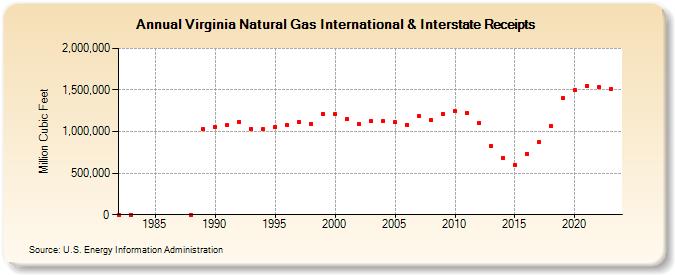
| Virginia Natural Gas International & Interstate Receipts (Million Cubic Feet) | |||||
| Decade | Year-0 | Year-1 | Year-2 | Year-3 | Year-4 | Year-5 | Year-6 | Year-7 | Year-8 | Year-9 |
|---|---|---|---|---|---|---|---|---|---|---|
| 1980's | 118 | 122 | 0 | 1,029,161 | ||||||
| 1990's | 1,059,259 | 1,077,858 | 1,119,418 | 1,035,590 | 1,025,827 | 1,055,691 | 1,074,350 | 1,120,061 | 1,091,838 | 1,215,366 |
| 2000's | 1,209,209 | 1,155,432 | 1,090,377 | 1,126,447 | 1,127,479 | 1,114,460 | 1,083,979 | 1,182,280 | 1,139,966 | 1,214,463 |
| 2010's | 1,245,106 | 1,224,467 | 1,108,814 | 825,611 | 686,521 | 602,589 | 734,841 | 870,746 | 1,067,190 | 1,397,597 |
| 2020's | 1,493,660 | 1,546,300 | 1,533,127 | 1,511,989 | 1,453,903 |
| - = No Data Reported; -- = Not Applicable; NA = Not Available; W = Withheld to avoid disclosure of individual company data. |
| Release Date: 6/30/2026 |
| Next Release Date: 7/31/2026 |