|
Download Data (XLS File) |
|
|||||
|
|||||
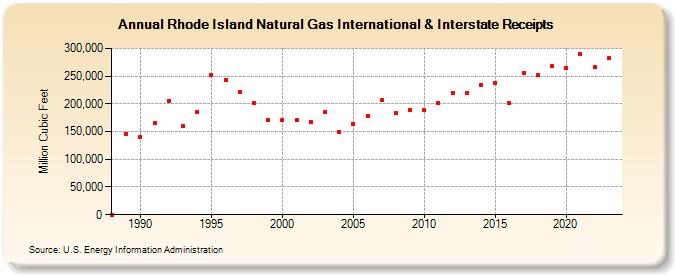
| Rhode Island Natural Gas International & Interstate Receipts (Million Cubic Feet) | |||||
| Decade | Year-0 | Year-1 | Year-2 | Year-3 | Year-4 | Year-5 | Year-6 | Year-7 | Year-8 | Year-9 |
|---|---|---|---|---|---|---|---|---|---|---|
| 1980's | 0 | 146,218 | ||||||||
| 1990's | 140,431 | 166,305 | 205,808 | 159,848 | 184,516 | 251,800 | 243,047 | 221,909 | 201,303 | 170,823 |
| 2000's | 170,561 | 170,893 | 167,032 | 185,062 | 149,987 | 163,487 | 178,370 | 207,075 | 183,016 | 188,946 |
| 2010's | 189,108 | 201,157 | 219,788 | 219,504 | 234,271 | 238,378 | 200,956 | 255,841 | 251,877 | 267,776 |
| 2020's | 264,594 | 290,010 | 266,914 | 282,075 | 286,348 |
| - = No Data Reported; -- = Not Applicable; NA = Not Available; W = Withheld to avoid disclosure of individual company data. |
| Release Date: 6/30/2026 |
| Next Release Date: 7/31/2026 |