|
Download Data (XLS File) |
|
|||||
|
|||||
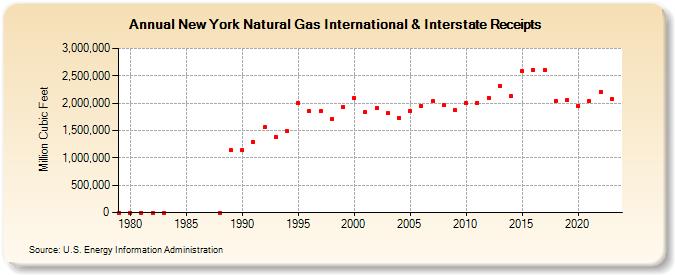
| New York Natural Gas International & Interstate Receipts (Million Cubic Feet) | |||||
| Decade | Year-0 | Year-1 | Year-2 | Year-3 | Year-4 | Year-5 | Year-6 | Year-7 | Year-8 | Year-9 |
|---|---|---|---|---|---|---|---|---|---|---|
| 1970's | 193 | |||||||||
| 1980's | 211 | 208 | 262 | 226 | 0 | 1,134,621 | ||||
| 1990's | 1,137,815 | 1,293,511 | 1,556,648 | 1,383,948 | 1,488,994 | 2,006,959 | 1,847,332 | 1,853,100 | 1,708,542 | 1,928,401 |
| 2000's | 2,095,164 | 1,834,136 | 1,910,215 | 1,818,125 | 1,734,136 | 1,851,838 | 1,943,115 | 2,035,248 | 1,960,240 | 1,870,178 |
| 2010's | 2,003,874 | 2,007,886 | 2,094,121 | 2,313,357 | 2,129,749 | 2,579,610 | 2,604,772 | 2,606,135 | 2,044,830 | 2,060,824 |
| 2020's | 1,956,048 | 2,042,646 | 2,207,298 | 2,077,142 | 2,231,156 |
| - = No Data Reported; -- = Not Applicable; NA = Not Available; W = Withheld to avoid disclosure of individual company data. |
| Release Date: 6/30/2026 |
| Next Release Date: 7/31/2026 |