|
Download Data (XLS File) |
|
|||||
|
|||||
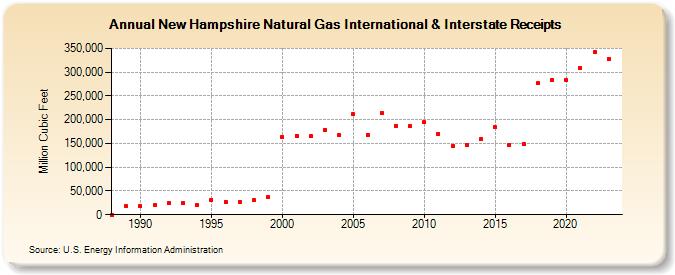
| New Hampshire Natural Gas International & Interstate Receipts (Million Cubic Feet) | |||||
| Decade | Year-0 | Year-1 | Year-2 | Year-3 | Year-4 | Year-5 | Year-6 | Year-7 | Year-8 | Year-9 |
|---|---|---|---|---|---|---|---|---|---|---|
| 1980's | 0 | 17,736 | ||||||||
| 1990's | 18,090 | 19,494 | 24,110 | 24,232 | 20,249 | 31,742 | 27,435 | 27,720 | 30,093 | 36,644 |
| 2000's | 163,673 | 166,591 | 165,007 | 178,968 | 166,930 | 211,772 | 167,987 | 214,655 | 187,370 | 186,661 |
| 2010's | 194,332 | 170,652 | 144,718 | 146,520 | 159,648 | 183,890 | 147,279 | 148,510 | 276,542 | 283,812 |
| 2020's | 283,957 | 308,213 | 343,316 | 328,657 | 391,164 |
| - = No Data Reported; -- = Not Applicable; NA = Not Available; W = Withheld to avoid disclosure of individual company data. |
| Release Date: 6/30/2026 |
| Next Release Date: 7/31/2026 |