|
Download Data (XLS File) |
|
|||||
|
|||||
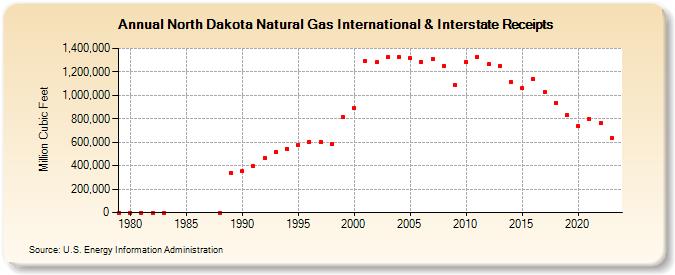
| North Dakota Natural Gas International & Interstate Receipts (Million Cubic Feet) | |||||
| Decade | Year-0 | Year-1 | Year-2 | Year-3 | Year-4 | Year-5 | Year-6 | Year-7 | Year-8 | Year-9 |
|---|---|---|---|---|---|---|---|---|---|---|
| 1970's | 207 | |||||||||
| 1980's | 284 | 355 | 401 | 448 | 0 | 338,072 | ||||
| 1990's | 351,741 | 394,319 | 465,592 | 517,897 | 545,160 | 579,326 | 604,154 | 604,009 | 587,553 | 811,518 |
| 2000's | 892,048 | 1,293,311 | 1,279,778 | 1,326,759 | 1,327,246 | 1,315,116 | 1,282,897 | 1,310,192 | 1,248,069 | 1,087,736 |
| 2010's | 1,284,983 | 1,327,403 | 1,264,016 | 1,249,821 | 1,113,525 | 1,058,392 | 1,138,700 | 1,027,862 | 937,093 | 828,801 |
| 2020's | 736,878 | 797,785 | 760,077 | 636,008 | 641,871 |
| - = No Data Reported; -- = Not Applicable; NA = Not Available; W = Withheld to avoid disclosure of individual company data. |
| Release Date: 6/30/2026 |
| Next Release Date: 7/31/2026 |