|
Download Data (XLS File) |
|
|||||
|
|||||
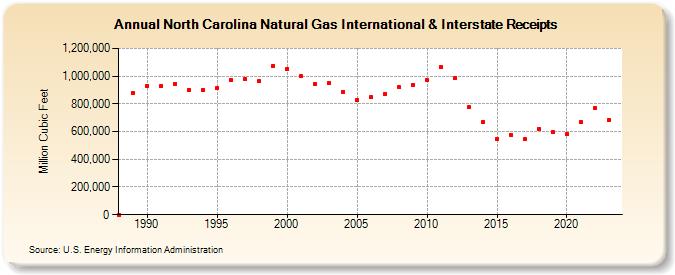
| North Carolina Natural Gas International & Interstate Receipts (Million Cubic Feet) | |||||
| Decade | Year-0 | Year-1 | Year-2 | Year-3 | Year-4 | Year-5 | Year-6 | Year-7 | Year-8 | Year-9 |
|---|---|---|---|---|---|---|---|---|---|---|
| 1980's | 0 | 878,416 | ||||||||
| 1990's | 931,485 | 928,505 | 943,723 | 902,203 | 901,123 | 913,692 | 970,866 | 976,910 | 962,544 | 1,073,958 |
| 2000's | 1,051,425 | 998,617 | 943,012 | 951,772 | 885,476 | 829,130 | 846,772 | 871,237 | 918,391 | 938,779 |
| 2010's | 971,210 | 1,065,115 | 987,283 | 776,261 | 666,689 | 549,212 | 576,220 | 545,883 | 620,787 | 595,836 |
| 2020's | 581,973 | 666,699 | 769,574 | 686,313 | 720,658 |
| - = No Data Reported; -- = Not Applicable; NA = Not Available; W = Withheld to avoid disclosure of individual company data. |
| Release Date: 6/30/2026 |
| Next Release Date: 7/31/2026 |