|
Download Data (XLS File) |
|
|||||
|
|||||
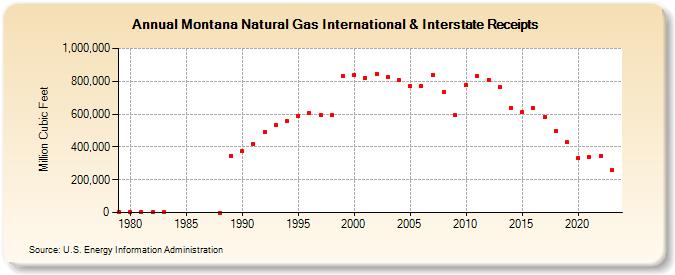
| Montana Natural Gas International & Interstate Receipts (Million Cubic Feet) | |||||
| Decade | Year-0 | Year-1 | Year-2 | Year-3 | Year-4 | Year-5 | Year-6 | Year-7 | Year-8 | Year-9 |
|---|---|---|---|---|---|---|---|---|---|---|
| 1970's | 893 | |||||||||
| 1980's | 786 | 1,186 | 1,247 | 789 | 0 | 345,797 | ||||
| 1990's | 372,344 | 415,591 | 488,827 | 530,587 | 556,263 | 590,604 | 603,959 | 592,031 | 596,958 | 830,995 |
| 2000's | 839,412 | 822,332 | 846,053 | 823,859 | 807,195 | 771,313 | 771,533 | 839,185 | 732,055 | 593,423 |
| 2010's | 775,978 | 831,996 | 810,022 | 765,580 | 638,389 | 610,596 | 638,897 | 583,061 | 498,754 | 426,820 |
| 2020's | 330,950 | 338,242 | 347,040 | 256,376 | 269,256 |
| - = No Data Reported; -- = Not Applicable; NA = Not Available; W = Withheld to avoid disclosure of individual company data. |
| Release Date: 6/30/2026 |
| Next Release Date: 7/31/2026 |