|
Download Data (XLS File) |
|
|||||
|
|||||
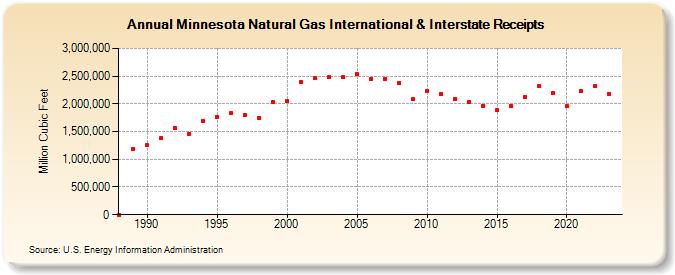
| Minnesota Natural Gas International & Interstate Receipts (Million Cubic Feet) | |||||
| Decade | Year-0 | Year-1 | Year-2 | Year-3 | Year-4 | Year-5 | Year-6 | Year-7 | Year-8 | Year-9 |
|---|---|---|---|---|---|---|---|---|---|---|
| 1980's | 0 | 1,190,761 | ||||||||
| 1990's | 1,249,797 | 1,379,887 | 1,561,929 | 1,464,076 | 1,689,322 | 1,762,668 | 1,830,533 | 1,800,664 | 1,747,850 | 2,031,358 |
| 2000's | 2,054,162 | 2,389,540 | 2,457,399 | 2,485,345 | 2,477,350 | 2,531,359 | 2,450,740 | 2,452,686 | 2,383,666 | 2,079,076 |
| 2010's | 2,239,042 | 2,179,346 | 2,089,313 | 2,033,325 | 1,965,844 | 1,883,915 | 1,968,966 | 2,131,350 | 2,312,633 | 2,189,273 |
| 2020's | 1,955,412 | 2,230,431 | 2,316,094 | 2,177,326 | 2,334,235 |
| - = No Data Reported; -- = Not Applicable; NA = Not Available; W = Withheld to avoid disclosure of individual company data. |
| Release Date: 6/30/2026 |
| Next Release Date: 7/31/2026 |