|
Download Data (XLS File) |
|
|||||
|
|||||
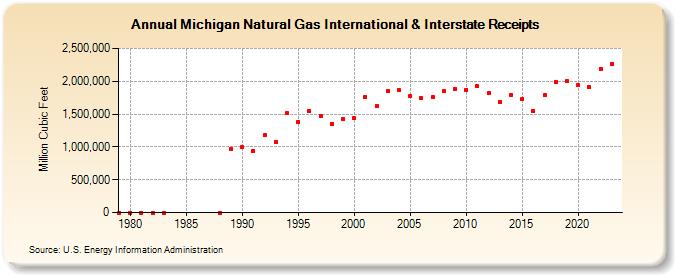
| Michigan Natural Gas International & Interstate Receipts (Million Cubic Feet) | |||||
| Decade | Year-0 | Year-1 | Year-2 | Year-3 | Year-4 | Year-5 | Year-6 | Year-7 | Year-8 | Year-9 |
|---|---|---|---|---|---|---|---|---|---|---|
| 1970's | 621 | |||||||||
| 1980's | 601 | 668 | 494 | 481 | 0 | 972,991 | ||||
| 1990's | 993,264 | 943,310 | 1,174,348 | 1,077,652 | 1,513,237 | 1,382,220 | 1,545,671 | 1,475,984 | 1,353,761 | 1,425,650 |
| 2000's | 1,432,491 | 1,759,938 | 1,624,147 | 1,853,615 | 1,864,893 | 1,770,207 | 1,737,224 | 1,759,405 | 1,846,048 | 1,874,538 |
| 2010's | 1,872,086 | 1,922,101 | 1,816,674 | 1,688,113 | 1,796,809 | 1,726,720 | 1,544,439 | 1,787,756 | 1,985,548 | 2,001,650 |
| 2020's | 1,935,871 | 1,908,221 | 2,187,680 | 2,267,331 | 2,153,058 |
| - = No Data Reported; -- = Not Applicable; NA = Not Available; W = Withheld to avoid disclosure of individual company data. |
| Release Date: 6/30/2026 |
| Next Release Date: 7/31/2026 |