|
Download Data (XLS File) |
|
|||||
|
|||||
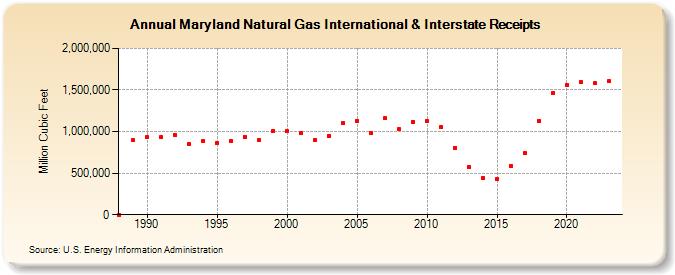
| Maryland Natural Gas International & Interstate Receipts (Million Cubic Feet) | |||||
| Decade | Year-0 | Year-1 | Year-2 | Year-3 | Year-4 | Year-5 | Year-6 | Year-7 | Year-8 | Year-9 |
|---|---|---|---|---|---|---|---|---|---|---|
| 1980's | 0 | 893,124 | ||||||||
| 1990's | 931,632 | 931,110 | 959,084 | 855,001 | 883,179 | 864,322 | 882,473 | 932,773 | 894,531 | 1,010,107 |
| 2000's | 1,003,523 | 977,218 | 896,581 | 950,315 | 1,100,621 | 1,130,631 | 984,989 | 1,158,958 | 1,027,082 | 1,118,051 |
| 2010's | 1,122,995 | 1,053,186 | 806,482 | 574,968 | 443,394 | 425,556 | 586,394 | 736,786 | 1,130,599 | 1,469,233 |
| 2020's | 1,557,267 | 1,589,998 | 1,579,220 | 1,603,922 | 1,513,176 |
| - = No Data Reported; -- = Not Applicable; NA = Not Available; W = Withheld to avoid disclosure of individual company data. |
| Release Date: 6/30/2026 |
| Next Release Date: 7/31/2026 |