|
Download Data (XLS File) |
|
|||||
|
|||||
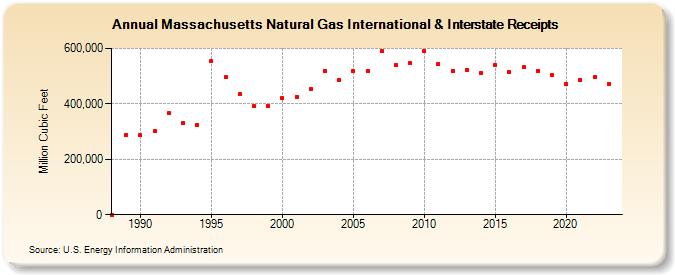
| Massachusetts Natural Gas International & Interstate Receipts (Million Cubic Feet) | |||||
| Decade | Year-0 | Year-1 | Year-2 | Year-3 | Year-4 | Year-5 | Year-6 | Year-7 | Year-8 | Year-9 |
|---|---|---|---|---|---|---|---|---|---|---|
| 1980's | 0 | 286,944 | ||||||||
| 1990's | 285,903 | 302,341 | 365,296 | 329,821 | 325,052 | 554,297 | 495,875 | 434,532 | 392,679 | 391,996 |
| 2000's | 420,190 | 425,928 | 454,351 | 519,846 | 487,575 | 518,013 | 517,398 | 590,427 | 540,440 | 546,381 |
| 2010's | 592,192 | 544,630 | 518,063 | 521,470 | 512,454 | 541,270 | 513,321 | 531,894 | 518,827 | 502,545 |
| 2020's | 471,543 | 487,714 | 496,365 | 472,040 | 488,808 |
| - = No Data Reported; -- = Not Applicable; NA = Not Available; W = Withheld to avoid disclosure of individual company data. |
| Release Date: 6/30/2026 |
| Next Release Date: 7/31/2026 |