|
Download Data (XLS File) |
|
|||||
|
|||||
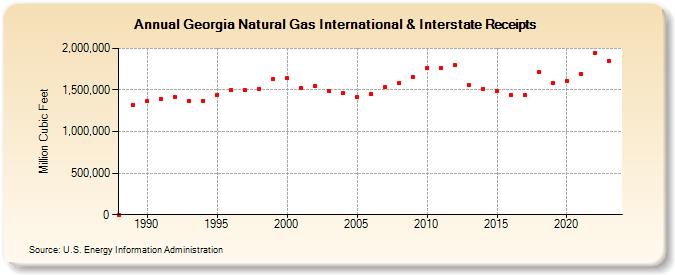
| Georgia Natural Gas International & Interstate Receipts (Million Cubic Feet) | |||||
| Decade | Year-0 | Year-1 | Year-2 | Year-3 | Year-4 | Year-5 | Year-6 | Year-7 | Year-8 | Year-9 |
|---|---|---|---|---|---|---|---|---|---|---|
| 1980's | 0 | 1,320,609 | ||||||||
| 1990's | 1,361,415 | 1,397,050 | 1,418,312 | 1,371,442 | 1,371,651 | 1,439,907 | 1,502,968 | 1,498,880 | 1,511,671 | 1,631,329 |
| 2000's | 1,640,769 | 1,526,461 | 1,549,014 | 1,491,092 | 1,458,395 | 1,414,612 | 1,451,143 | 1,536,259 | 1,588,699 | 1,654,814 |
| 2010's | 1,766,523 | 1,760,305 | 1,798,819 | 1,554,609 | 1,508,692 | 1,487,316 | 1,440,794 | 1,433,929 | 1,711,021 | 1,587,592 |
| 2020's | 1,611,718 | 1,693,554 | 1,950,518 | 1,851,252 | 1,880,152 |
| - = No Data Reported; -- = Not Applicable; NA = Not Available; W = Withheld to avoid disclosure of individual company data. |
| Release Date: 6/30/2026 |
| Next Release Date: 7/31/2026 |