|
Download Data (XLS File) |
|
|||||
|
|||||
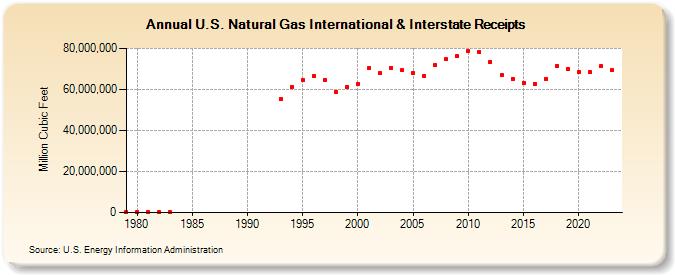
| U.S. Natural Gas International & Interstate Receipts (Million Cubic Feet) | |||||
| Decade | Year-0 | Year-1 | Year-2 | Year-3 | Year-4 | Year-5 | Year-6 | Year-7 | Year-8 | Year-9 |
|---|---|---|---|---|---|---|---|---|---|---|
| 1970's | 149,032 | |||||||||
| 1980's | 148,910 | 144,249 | 147,888 | 147,172 | ||||||
| 1990's | 55,348,260 | 61,081,540 | 64,500,580 | 66,427,622 | 64,741,721 | 58,773,312 | 61,392,733 | |||
| 2000's | 62,797,780 | 70,290,945 | 67,993,634 | 70,468,088 | 69,271,464 | 67,925,925 | 66,564,057 | 71,921,405 | 74,671,042 | 76,068,752 |
| 2010's | 78,835,235 | 78,241,063 | 73,393,413 | 67,088,737 | 65,262,988 | 63,327,518 | 62,771,767 | 65,273,708 | 71,314,540 | 70,176,858 |
| 2020's | 68,518,009 | 68,544,401 | 71,275,656 | 69,229,498 | 70,322,868 |
| - = No Data Reported; -- = Not Applicable; NA = Not Available; W = Withheld to avoid disclosure of individual company data. |
| Release Date: 6/30/2026 |
| Next Release Date: 7/31/2026 |
Referring Pages: