|
Download Data (XLS File) |
|
|||||
|
|||||
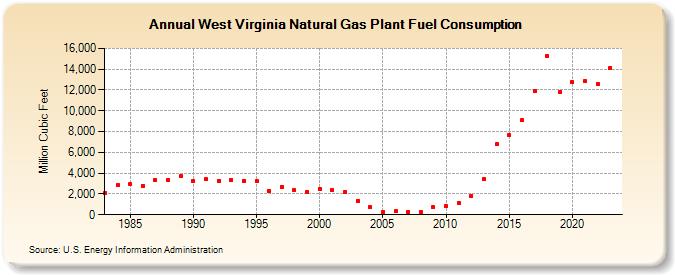
| West Virginia Natural Gas Plant Fuel Consumption (Million Cubic Feet) | |||||
| Decade | Year-0 | Year-1 | Year-2 | Year-3 | Year-4 | Year-5 | Year-6 | Year-7 | Year-8 | Year-9 |
|---|---|---|---|---|---|---|---|---|---|---|
| 1980's | 2,106 | 2,855 | 2,920 | 2,809 | 3,355 | 3,326 | 3,679 | |||
| 1990's | 3,204 | 3,391 | 3,290 | 3,316 | 3,272 | 3,199 | 2,262 | 2,710 | 2,344 | 2,209 |
| 2000's | 2,505 | 2,342 | 2,186 | 1,361 | 723 | 281 | 315 | 309 | 283 | 698 |
| 2010's | 810 | 1,153 | 1,812 | 3,429 | 6,776 | 7,685 | 9,068 | 11,909 | 15,234 | 11,797 |
| 2020's | 12,751 | 12,862 | 12,588 | 14,141 | 16,077 |
| - = No Data Reported; -- = Not Applicable; NA = Not Available; W = Withheld to avoid disclosure of individual company data. |
| Release Date: 6/30/2026 |
| Next Release Date: 7/31/2026 |