|
Download Data (XLS File) |
|
|||||
|
|||||
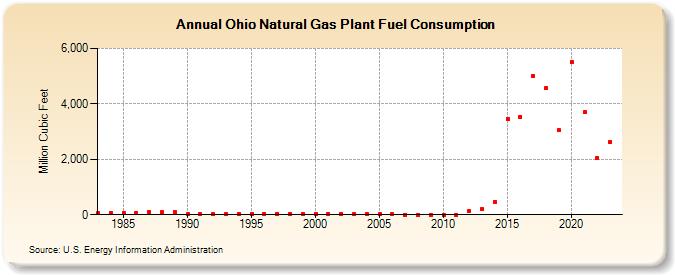
| Ohio Natural Gas Plant Fuel Consumption (Million Cubic Feet) | |||||
| Decade | Year-0 | Year-1 | Year-2 | Year-3 | Year-4 | Year-5 | Year-6 | Year-7 | Year-8 | Year-9 |
|---|---|---|---|---|---|---|---|---|---|---|
| 1980's | 50 | 63 | 71 | 69 | 96 | 88 | 87 | |||
| 1990's | 14 | 14 | 16 | 20 | 36 | 32 | 37 | 39 | 40 | 42 |
| 2000's | 43 | 40 | 37 | 17 | 18 | 12 | 8 | 5 | 0 | 0 |
| 2010's | 0 | 0 | 127 | 202 | 468 | 3,464 | 3,542 | 5,011 | 4,578 | 3,043 |
| 2020's | 5,527 | 3,702 | 2,038 | 2,637 | 3,750 |
| - = No Data Reported; -- = Not Applicable; NA = Not Available; W = Withheld to avoid disclosure of individual company data. |
| Release Date: 6/30/2026 |
| Next Release Date: 7/31/2026 |