|
Download Data (XLS File) |
|
|||||
|
|||||
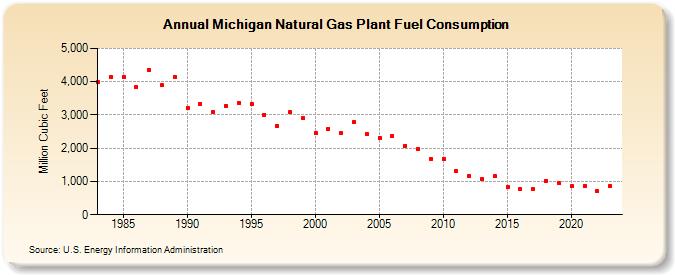
| Michigan Natural Gas Plant Fuel Consumption (Million Cubic Feet) | |||||
| Decade | Year-0 | Year-1 | Year-2 | Year-3 | Year-4 | Year-5 | Year-6 | Year-7 | Year-8 | Year-9 |
|---|---|---|---|---|---|---|---|---|---|---|
| 1980's | 3,995 | 4,136 | 4,142 | 3,831 | 4,365 | 3,896 | 4,141 | |||
| 1990's | 3,212 | 3,343 | 3,096 | 3,282 | 3,367 | 3,337 | 3,011 | 2,674 | 3,073 | 2,912 |
| 2000's | 2,455 | 2,587 | 2,445 | 2,798 | 2,419 | 2,318 | 2,363 | 2,076 | 1,982 | 1,686 |
| 2010's | 1,684 | 1,303 | 1,174 | 1,071 | 1,152 | 839 | 759 | 760 | 1,015 | 940 |
| 2020's | 862 | 869 | 701 | 877 | 763 |
| - = No Data Reported; -- = Not Applicable; NA = Not Available; W = Withheld to avoid disclosure of individual company data. |
| Release Date: 6/30/2026 |
| Next Release Date: 7/31/2026 |