|
Download Data (XLS File) |
|
|||||
|
|||||
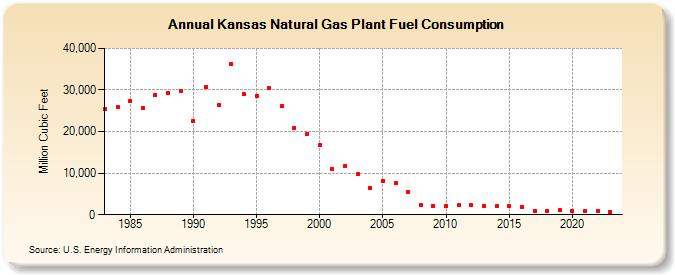
| Kansas Natural Gas Plant Fuel Consumption (Million Cubic Feet) | |||||
| Decade | Year-0 | Year-1 | Year-2 | Year-3 | Year-4 | Year-5 | Year-6 | Year-7 | Year-8 | Year-9 |
|---|---|---|---|---|---|---|---|---|---|---|
| 1980's | 25,430 | 25,873 | 27,297 | 25,616 | 28,804 | 29,357 | 29,665 | |||
| 1990's | 22,499 | 30,800 | 26,312 | 36,294 | 28,988 | 28,510 | 30,444 | 26,205 | 20,921 | 19,321 |
| 2000's | 16,664 | 10,928 | 11,723 | 9,706 | 6,460 | 8,100 | 7,541 | 5,439 | 2,331 | 2,126 |
| 2010's | 2,102 | 2,246 | 2,268 | 2,189 | 1,983 | 2,052 | 1,925 | 990 | 987 | 1,128 |
| 2020's | 851 | 857 | 923 | 727 | 695 |
| - = No Data Reported; -- = Not Applicable; NA = Not Available; W = Withheld to avoid disclosure of individual company data. |
| Release Date: 6/30/2026 |
| Next Release Date: 7/31/2026 |