|
Download Data (XLS File) |
|
|||||
|
|||||
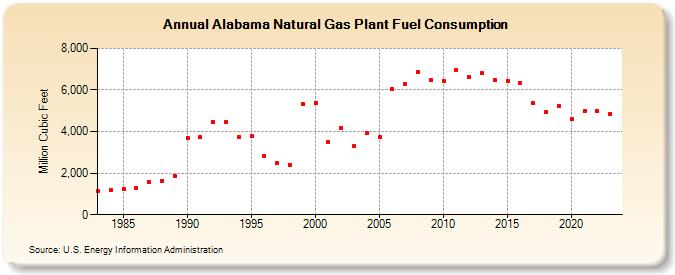
| Alabama Natural Gas Plant Fuel Consumption (Million Cubic Feet) | |||||
| Decade | Year-0 | Year-1 | Year-2 | Year-3 | Year-4 | Year-5 | Year-6 | Year-7 | Year-8 | Year-9 |
|---|---|---|---|---|---|---|---|---|---|---|
| 1980's | 1,129 | 1,178 | 1,249 | 1,303 | 1,564 | 1,634 | 1,875 | |||
| 1990's | 3,710 | 3,720 | 4,477 | 4,453 | 3,747 | 3,806 | 2,827 | 2,468 | 2,391 | 5,336 |
| 2000's | 5,377 | 3,491 | 4,148 | 3,293 | 3,914 | 3,740 | 6,028 | 6,269 | 6,858 | 6,470 |
| 2010's | 6,441 | 6,939 | 6,616 | 6,804 | 6,462 | 6,436 | 6,344 | 5,372 | 4,943 | 5,240 |
| 2020's | 4,585 | 4,987 | 5,012 | 3,521 | 3,378 |
| - = No Data Reported; -- = Not Applicable; NA = Not Available; W = Withheld to avoid disclosure of individual company data. |
| Release Date: 6/30/2026 |
| Next Release Date: 7/31/2026 |