|
Download Data (XLS File) |
|
|||||
|
|||||
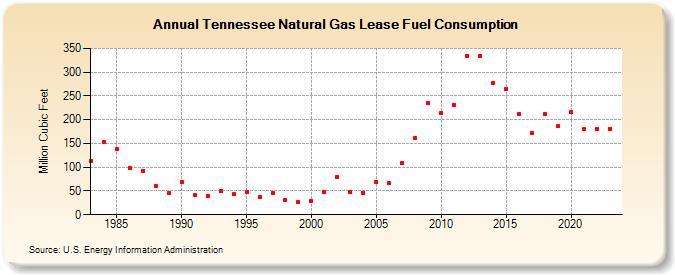
| Tennessee Natural Gas Lease Fuel Consumption (Million Cubic Feet) | |||||
| Decade | Year-0 | Year-1 | Year-2 | Year-3 | Year-4 | Year-5 | Year-6 | Year-7 | Year-8 | Year-9 |
|---|---|---|---|---|---|---|---|---|---|---|
| 1980's | 113 | 153 | 138 | 98 | 93 | 60 | 45 | |||
| 1990's | 68 | 41 | 39 | 49 | 44 | 47 | 37 | 45 | 31 | 26 |
| 2000's | 29 | 48 | 80 | 47 | 46 | 68 | 66 | 109 | 161 | 235 |
| 2010's | 214 | 231 | 335 | 335 | 278 | 265 | 211 | 171 | 211 | 186 |
| 2020's | 216 | 181 | 180 | 160 | 160 |
| - = No Data Reported; -- = Not Applicable; NA = Not Available; W = Withheld to avoid disclosure of individual company data. |
| Release Date: 6/30/2026 |
| Next Release Date: 7/31/2026 |