|
Download Data (XLS File) |
|
|||||
|
|||||
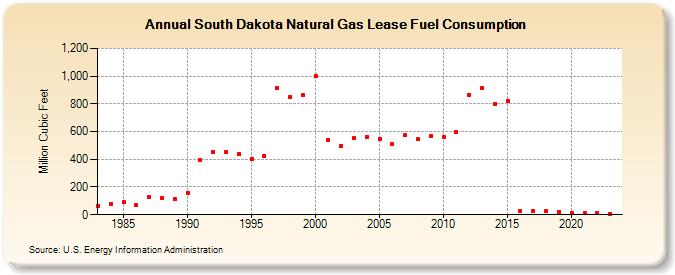
| South Dakota Natural Gas Lease Fuel Consumption (Million Cubic Feet) | |||||
| Decade | Year-0 | Year-1 | Year-2 | Year-3 | Year-4 | Year-5 | Year-6 | Year-7 | Year-8 | Year-9 |
|---|---|---|---|---|---|---|---|---|---|---|
| 1980's | 61 | 76 | 93 | 70 | 125 | 123 | 112 | |||
| 1990's | 158 | 393 | 451 | 452 | 437 | 404 | 424 | 911 | 848 | 864 |
| 2000's | 1,003 | 538 | 495 | 553 | 562 | 545 | 508 | 573 | 545 | 568 |
| 2010's | 562 | 594 | 866 | 916 | 799 | 820 | 25 | 26 | 25 | 23 |
| 2020's | 9 | 9 | 9 | 7 | 7 |
| - = No Data Reported; -- = Not Applicable; NA = Not Available; W = Withheld to avoid disclosure of individual company data. |
| Release Date: 6/30/2026 |
| Next Release Date: 7/31/2026 |