|
Download Data (XLS File) |
|
|||||
|
|||||
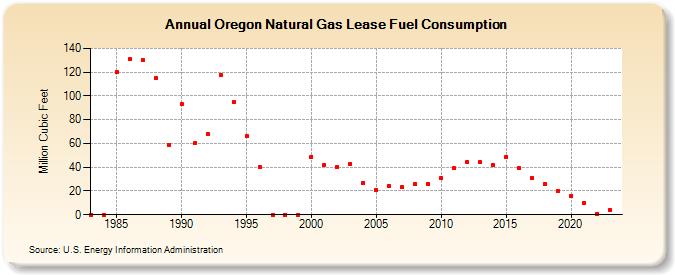
| Oregon Natural Gas Lease Fuel Consumption (Million Cubic Feet) | |||||
| Decade | Year-0 | Year-1 | Year-2 | Year-3 | Year-4 | Year-5 | Year-6 | Year-7 | Year-8 | Year-9 |
|---|---|---|---|---|---|---|---|---|---|---|
| 1980's | 0 | 0 | 120 | 131 | 130 | 115 | 59 | |||
| 1990's | 93 | 60 | 68 | 118 | 95 | 66 | 40 | 0 | 0 | 0 |
| 2000's | 49 | 42 | 40 | 43 | 27 | 21 | 24 | 23 | 26 | 26 |
| 2010's | 31 | 39 | 44 | 44 | 42 | 49 | 39 | 31 | 26 | 20 |
| 2020's | 16 | 10 | 1 | 4 | 4 |
| - = No Data Reported; -- = Not Applicable; NA = Not Available; W = Withheld to avoid disclosure of individual company data. |
| Release Date: 6/30/2026 |
| Next Release Date: 7/31/2026 |