|
Download Data (XLS File) |
|
|||||
|
|||||
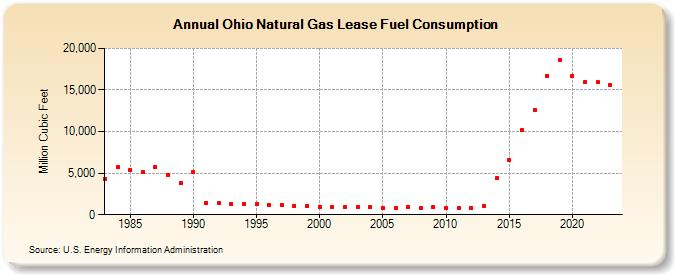
| Ohio Natural Gas Lease Fuel Consumption (Million Cubic Feet) | |||||
| Decade | Year-0 | Year-1 | Year-2 | Year-3 | Year-4 | Year-5 | Year-6 | Year-7 | Year-8 | Year-9 |
|---|---|---|---|---|---|---|---|---|---|---|
| 1980's | 4,327 | 5,678 | 5,371 | 5,174 | 5,706 | 4,781 | 3,789 | |||
| 1990's | 5,115 | 1,462 | 1,434 | 1,346 | 1,296 | 1,251 | 1,193 | 1,162 | 1,085 | 1,035 |
| 2000's | 986 | 983 | 972 | 936 | 894 | 833 | 855 | 872 | 840 | 879 |
| 2010's | 773 | 781 | 836 | 1,079 | 4,363 | 6,548 | 10,223 | 12,648 | 16,692 | 18,561 |
| 2020's | 16,727 | 15,951 | 15,925 | 15,587 | 15,092 |
| - = No Data Reported; -- = Not Applicable; NA = Not Available; W = Withheld to avoid disclosure of individual company data. |
| Release Date: 5/29/2026 |
| Next Release Date: 6/30/2026 |