|
Download Data (XLS File) |
|
|||||
|
|||||
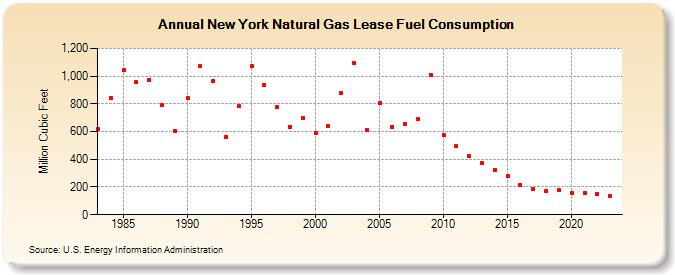
| New York Natural Gas Lease Fuel Consumption (Million Cubic Feet) | |||||
| Decade | Year-0 | Year-1 | Year-2 | Year-3 | Year-4 | Year-5 | Year-6 | Year-7 | Year-8 | Year-9 |
|---|---|---|---|---|---|---|---|---|---|---|
| 1980's | 617 | 840 | 1,041 | 957 | 975 | 788 | 604 | |||
| 1990's | 840 | 1,073 | 965 | 563 | 781 | 1,074 | 939 | 778 | 636 | 701 |
| 2000's | 590 | 640 | 876 | 1,094 | 614 | 803 | 635 | 657 | 687 | 1,005 |
| 2010's | 573 | 498 | 423 | 375 | 323 | 277 | 216 | 182 | 170 | 175 |
| 2020's | 155 | 155 | 151 | 133 | 141 |
| - = No Data Reported; -- = Not Applicable; NA = Not Available; W = Withheld to avoid disclosure of individual company data. |
| Release Date: 5/29/2026 |
| Next Release Date: 6/30/2026 |