|
Download Data (XLS File) |
|
|||||
|
|||||
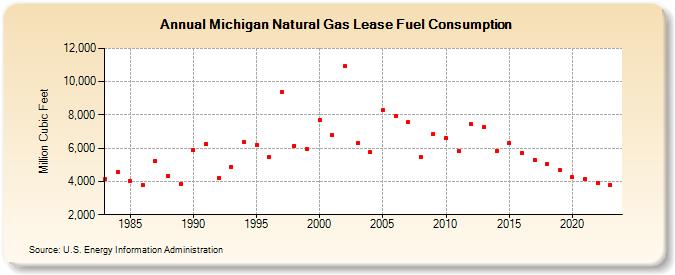
| Michigan Natural Gas Lease Fuel Consumption (Million Cubic Feet) | |||||
| Decade | Year-0 | Year-1 | Year-2 | Year-3 | Year-4 | Year-5 | Year-6 | Year-7 | Year-8 | Year-9 |
|---|---|---|---|---|---|---|---|---|---|---|
| 1980's | 4,135 | 4,574 | 4,053 | 3,778 | 5,251 | 4,354 | 3,862 | |||
| 1990's | 5,882 | 6,252 | 4,178 | 4,889 | 6,399 | 6,198 | 5,478 | 9,386 | 6,160 | 5,954 |
| 2000's | 7,689 | 6,799 | 10,925 | 6,309 | 5,755 | 8,276 | 7,932 | 7,588 | 5,447 | 6,841 |
| 2010's | 6,626 | 5,857 | 7,428 | 7,248 | 5,857 | 6,312 | 5,719 | 5,313 | 5,075 | 4,702 |
| 2020's | 4,252 | 4,147 | 3,915 | 3,826 | 3,591 |
| - = No Data Reported; -- = Not Applicable; NA = Not Available; W = Withheld to avoid disclosure of individual company data. |
| Release Date: 5/29/2026 |
| Next Release Date: 6/30/2026 |