|
Download Data (XLS File) |
|
|||||
|
|||||
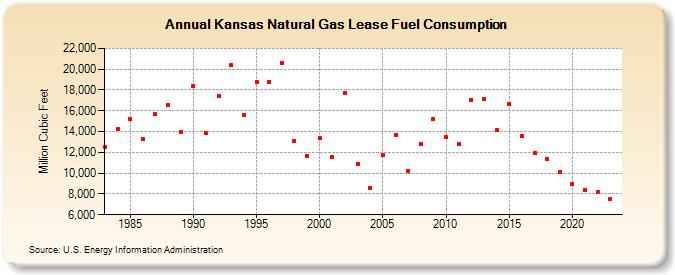
| Kansas Natural Gas Lease Fuel Consumption (Million Cubic Feet) | |||||
| Decade | Year-0 | Year-1 | Year-2 | Year-3 | Year-4 | Year-5 | Year-6 | Year-7 | Year-8 | Year-9 |
|---|---|---|---|---|---|---|---|---|---|---|
| 1980's | 12,471 | 14,232 | 15,160 | 13,269 | 15,701 | 16,571 | 13,965 | |||
| 1990's | 18,415 | 13,814 | 17,424 | 20,363 | 15,623 | 18,772 | 18,752 | 20,641 | 13,068 | 11,611 |
| 2000's | 13,338 | 11,598 | 17,693 | 10,861 | 8,589 | 11,734 | 13,681 | 10,232 | 12,803 | 15,169 |
| 2010's | 13,461 | 12,781 | 17,017 | 17,110 | 14,126 | 16,626 | 13,574 | 11,939 | 11,336 | 10,070 |
| 2020's | 8,985 | 8,414 | 8,137 | 7,529 | 6,927 |
| - = No Data Reported; -- = Not Applicable; NA = Not Available; W = Withheld to avoid disclosure of individual company data. |
| Release Date: 6/30/2026 |
| Next Release Date: 7/31/2026 |