|
Download Data (XLS File) |
|
|||||
|
|||||
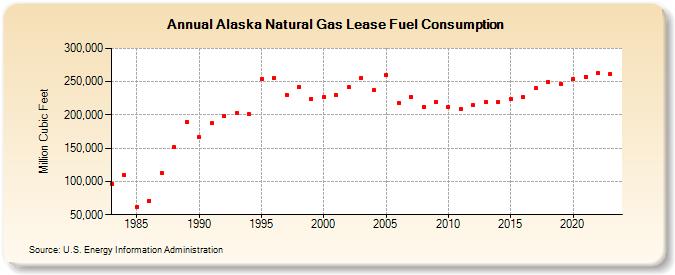
| Alaska Natural Gas Lease Fuel Consumption (Million Cubic Feet) | |||||
| Decade | Year-0 | Year-1 | Year-2 | Year-3 | Year-4 | Year-5 | Year-6 | Year-7 | Year-8 | Year-9 |
|---|---|---|---|---|---|---|---|---|---|---|
| 1980's | 96,603 | 109,333 | 62,341 | 71,104 | 112,404 | 151,280 | 189,702 | |||
| 1990's | 166,155 | 187,106 | 197,975 | 202,199 | 200,809 | 253,695 | 255,500 | 230,578 | 242,271 | 224,355 |
| 2000's | 226,659 | 229,206 | 241,469 | 255,701 | 237,530 | 259,829 | 218,153 | 227,374 | 211,878 | 219,161 |
| 2010's | 211,918 | 208,531 | 214,335 | 219,190 | 219,451 | 223,246 | 226,496 | 239,734 | 249,643 | 246,649 |
| 2020's | 253,758 | 257,603 | 262,586 | 261,601 | 266,033 |
| - = No Data Reported; -- = Not Applicable; NA = Not Available; W = Withheld to avoid disclosure of individual company data. |
| Release Date: 4/30/2026 |
| Next Release Date: 5/29/2026 |