|
Download Data (XLS File) |
|
|||||
|
|||||
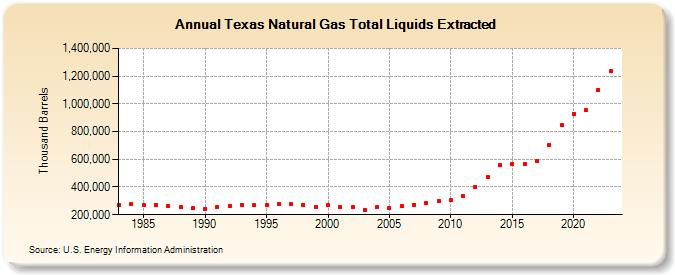
| Texas Natural Gas Total Liquids Extracted (Thousand Barrels) | |||||
| Decade | Year-0 | Year-1 | Year-2 | Year-3 | Year-4 | Year-5 | Year-6 | Year-7 | Year-8 | Year-9 |
|---|---|---|---|---|---|---|---|---|---|---|
| 1980's | 270,095 | 279,857 | 272,633 | 272,580 | 262,112 | 257,635 | 244,845 | |||
| 1990's | 244,106 | 253,476 | 264,766 | 271,351 | 267,602 | 269,758 | 279,650 | 275,315 | 272,512 | 257,661 |
| 2000's | 268,519 | 253,587 | 254,960 | 233,252 | 254,266 | 249,001 | 261,087 | 273,082 | 282,846 | 297,145 |
| 2010's | 304,093 | 334,219 | 401,728 | 474,441 | 557,798 | 567,505 | 569,490 | 585,351 | 703,155 | 845,425 |
| 2020's | 929,788 | 955,033 | 1,102,832 | 1,235,248 | 1,367,710 |
| - = No Data Reported; -- = Not Applicable; NA = Not Available; W = Withheld to avoid disclosure of individual company data. |
| Release Date: 6/30/2026 |
| Next Release Date: 7/31/2026 |
Referring Pages: