|
Download Data (XLS File) |
|
|||||
|
|||||
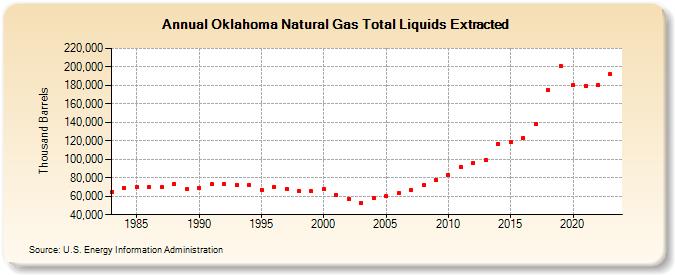
| Oklahoma Natural Gas Total Liquids Extracted (Thousand Barrels) | |||||
| Decade | Year-0 | Year-1 | Year-2 | Year-3 | Year-4 | Year-5 | Year-6 | Year-7 | Year-8 | Year-9 |
|---|---|---|---|---|---|---|---|---|---|---|
| 1980's | 64,418 | 68,914 | 70,445 | 70,458 | 69,746 | 73,507 | 67,509 | |||
| 1990's | 69,369 | 72,824 | 73,518 | 72,301 | 71,936 | 67,217 | 70,165 | 67,745 | 65,306 | 65,212 |
| 2000's | 67,664 | 61,780 | 57,163 | 53,116 | 58,437 | 59,958 | 62,992 | 66,458 | 71,637 | 77,140 |
| 2010's | 83,174 | 91,963 | 96,237 | 98,976 | 117,057 | 118,229 | 123,114 | 138,232 | 174,827 | 200,868 |
| 2020's | 180,034 | 179,663 | 179,937 | 192,343 | 184,634 |
| - = No Data Reported; -- = Not Applicable; NA = Not Available; W = Withheld to avoid disclosure of individual company data. |
| Release Date: 6/30/2026 |
| Next Release Date: 7/31/2026 |
Referring Pages: